


NAZCA-3D Functions (2)
Various scanning and analysis is available through software processing.
Scanning
Equipped with an operation palette designed to allow one-touch registration of the measurement starting/ending coordinates, as well as the number of data points and pitch intervals you want, NAZCA-3D is designed to allow anyone to analyze surface texture of objects and acquire 3D data in a simple and easy manner. To move the stage to specify the measurement position, you can use the [eight-direction key] provided on the above-mentioned operation palette or the cross key on the keyboard, allowing you to control the movement of the stage in a seamless manner.
Further, the system is equipped with a multi-scan mode to allow you to scan more than one area in your selected surface texture continuously in a single operation, thereby achieving sharp time reduction and automatization of your surface texture image processing.
In addition to the above-mentioned palette, the system is equipped with the [Preview] palette designed to allow you to visually check and move the present position and the measurement locations.
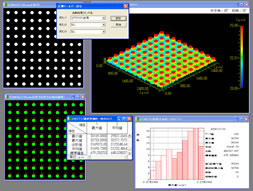
Viewer
NAZCA-3D is designed with an image viewer to allow the 3D data generated by the scanning process to be displayed in various modes such as pseudo color and monochrome, as well as wire frame and surface enabling the surface texture of the object to be graphically represented in a realistic manner. The image viewer also provides the function to allow you to enlarge/shrink the image with the mouse on a real time basis, as well as the function to allow you to set the display range scale to a specific value for comparative observation of the data.
Image Processing
NAZCA-3D is designed with a large variety of image data processing functions, including a regression function to allow you to analyze 3D data, which contains inclination or waviness (curve) components by removing or correcting the components of the data. If the data that you want to analyze contains noise caused by foreign matter or other factors, the system allows you to use the [Outlier correction] function to remove such noise before proceeding with the analysis of the data.
Measurement/Analysis
NZCA-3D is designed with an image data measurement/analysis function to allow the 3D data generated by the scanning process to be processed for line profile measurement (width, height, angle, R, comparison measurement), line/surface roughness (2001 JIS B0601 compliant Ra/Rz/Rq/Rmr, etc.), object volume, surface area, cross section and plane measurement (dimension, area, etc.). The system is also equipped with a function designed to allow you to statistically process the resultant measurement data to tabulate it as its statistical values (maximum, minimum, average, standard deviation, histogram) and further process it by Excel or other similar spreadsheet calculation software and save it as text data.
Customize
NAZCA-3D is designed to be customizable through the combination of image processing commands, allowing you to analyze and evaluate BGA, cream solders and other bumps for coplanarity and automate measurement of height from a certain reference plane, measurement of cross-sectional area and other measurements. The system is designed to allow anyone without knowledge of programming to customize its measurement function in a simple and easy manner.
Optional Software
You can select/use the following optional software depending on your needs.
| 3D Image Comparison/Analysis Software | Software designed for comparison/analysis of 3D images of work before and after its processing, and with its reference counterpart |
|---|---|
| Next-Generation 3D Surface Roughness Analysis Software | Software designed as a new system for plane-based evaluation of surface roughness |
| Grid Measurement Module | Module designed to allow shape information about chips arranged at equal intervals and other chips placed under similar conditions to be processed for measurement on a chip basis |